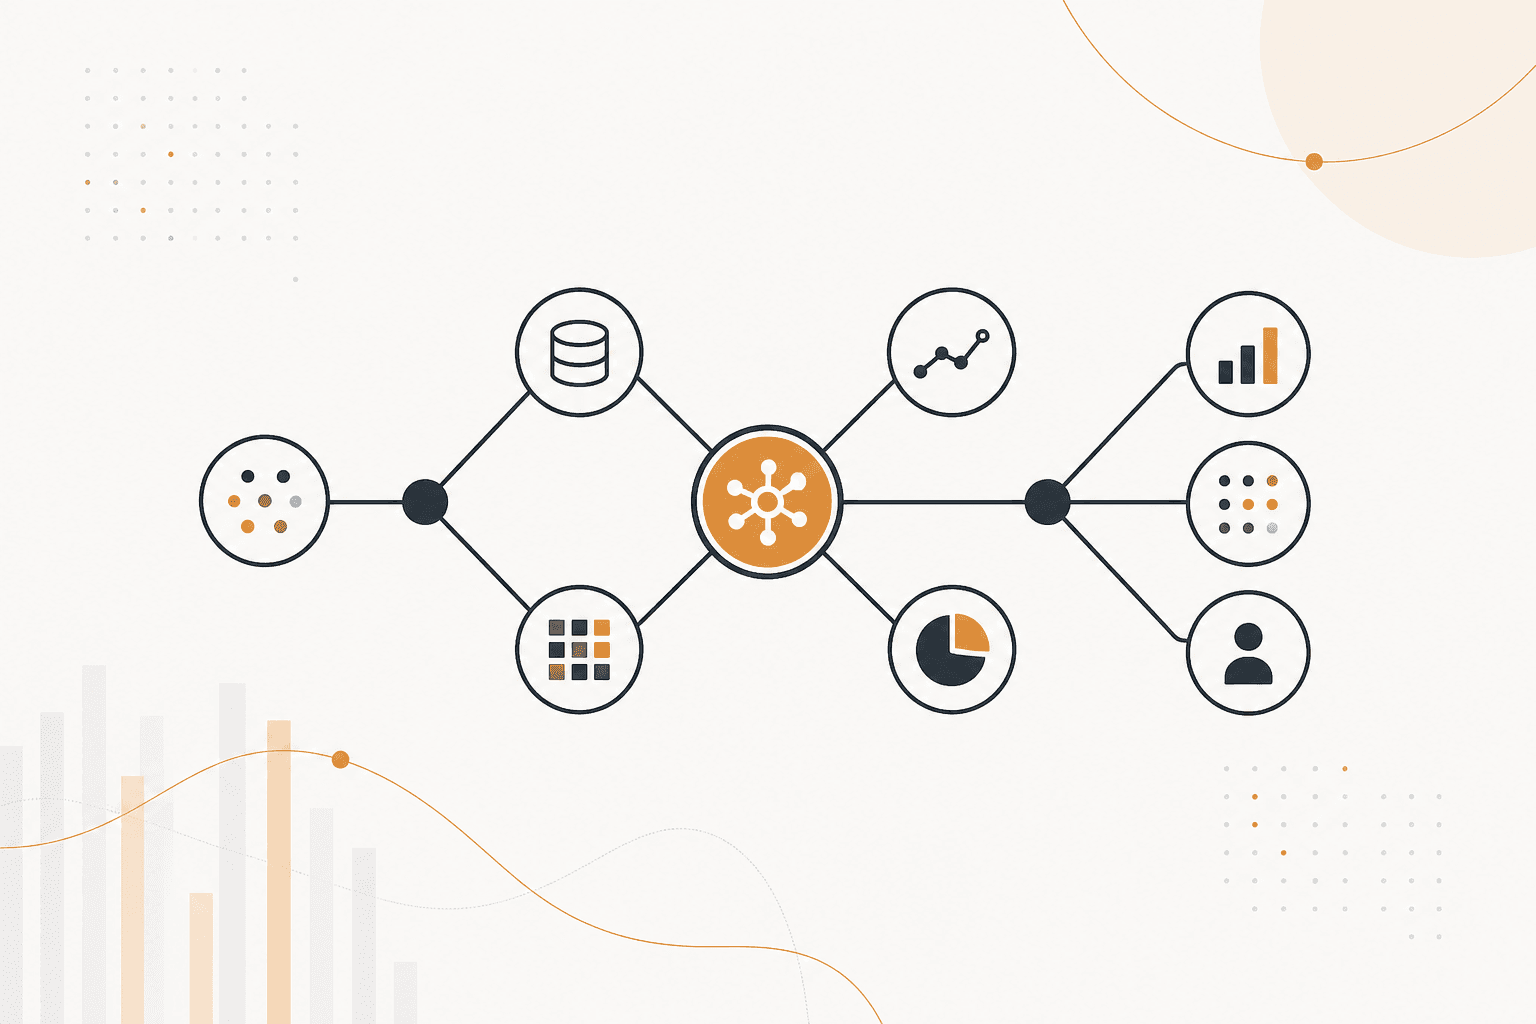
Data & Analytics ActionFlow use cases
Automated Weekly Marketing and Sales Report
Pull figures from every panel into one weekly report that says what changed rather than restating the current state.
Alert When a Metric Crosses a Threshold
When a metric exceeds its threshold, send an alert that includes the recent trend, so the reader can distinguish a spike from a shift.
Clean Raw Data and Write It to a Table
Validate messy records, separate duplicates, and write a clean table. Every rejected row is kept and labeled rather than dropped.
Compare the Same Data Across Two Sources
Read the same figures from two systems, list every row that disagrees, and describe the pattern in the disagreements rather than just counting them.
Explain a Change on a Dashboard
Take a metric that moved and produce a written explanation of the likely causes, with what the data supports kept separate from what is being guessed.
Monthly Cohort Report
Build the cohort table and add the short commentary that says which cohorts differ and by how much more than noise.
Group Survey Answers into Themes
Turn open-ended survey answers into themes with counts and a verbatim quote for each, grouped by what people meant rather than the words they used.
Morning Report on Overnight Jobs
One morning summary of what ran overnight, what failed, and which failures actually matter for the day ahead.
Data Quality Check Report
Scan tables for empty fields, outliers, and format errors, and report them ordered by what actually depends on each field.
One-Page Executive Summary
Turn the period's figures into a single page written for people who will not open the dashboard, with every number carrying its definition.
Frequently asked questions
The catalog covers ActionFlows and agents for work such as sales, support, marketing, finance, HR, legal, operations, and more. Each item is a real job you can clone or adapt.
Filter by category, then open the ActionFlow or agent that matches the job. If you already have an account, clone it into your organization and attach your credentials.
Yes. ActionFlows are graphs: models, integrations, conditions, loops, human approval, and nested subflows. Agents handle the work that is still a conversation.
Yes. Use cases, templates, and public listings on Explore are the examples. They describe the job and what to clone.
Cloning a template is minutes. Connecting credentials and checking a first run depends on the tools you attach. We do not promise a fixed delivery window.
Start building AI workflows
Create a free account, open a template or a blank canvas, and run your first ActionFlow.
Newsletter
Get product updates
New nodes, agents, and product notes. We send mail only when we have something worth opening.